Project 1: Company Sales Analysis Dashboard using Power BI
📌 Overview
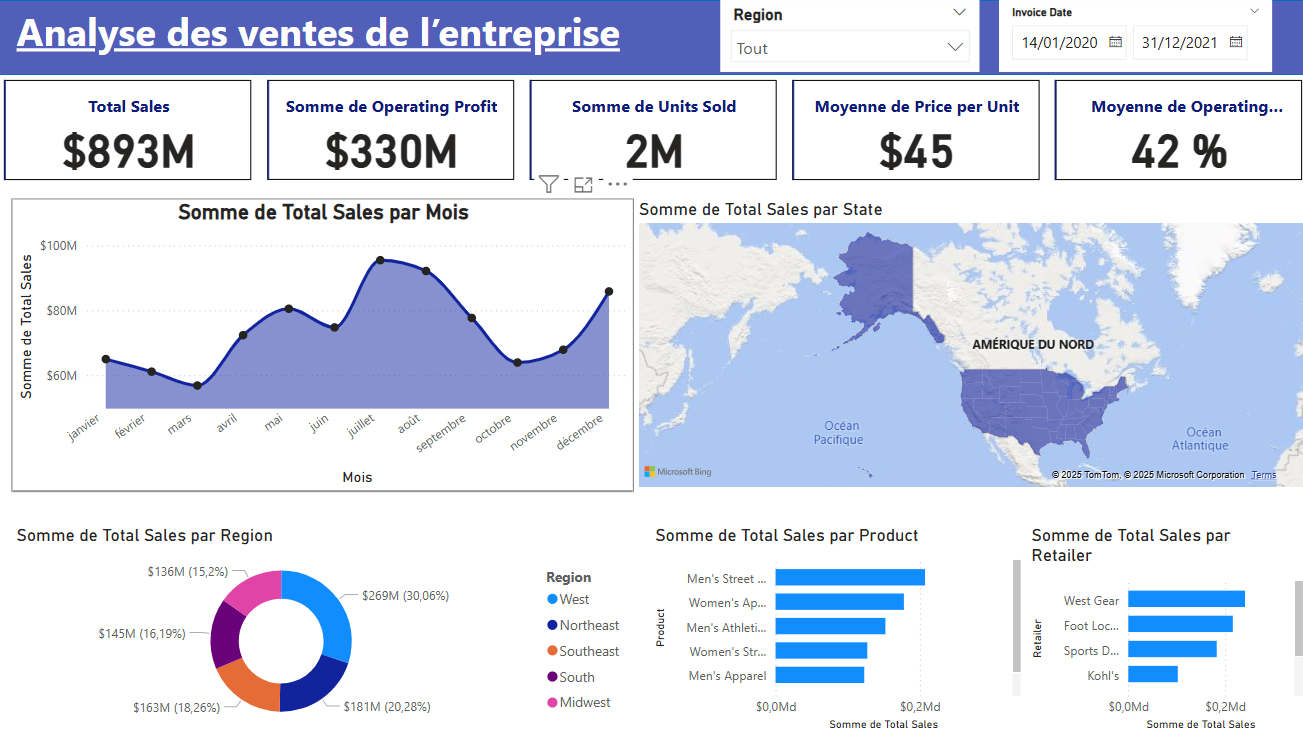
This project presents an interactive sales dashboard developed in Power BI, covering data from January 2020 to December 2021. It provides a comprehensive analysis of the company’s sales performance across regions, products, and retailers.
Dashboard Screenshot
📈 Dashboard Visuals
- Sales trend over time (monthly line chart)
- Total sales by product category and retailer (bar charts)
- Geographical sales heatmap
- Donut chart for regional sales breakdown
⚙️ Tools & Technologies
- Power BI (data modeling, DAX, interactive visuals)
- Excel / CSV data source integration
- Custom visual configuration
Project 2: Spotify Listening Behavior Dashboard using Power BI
📌 Overview
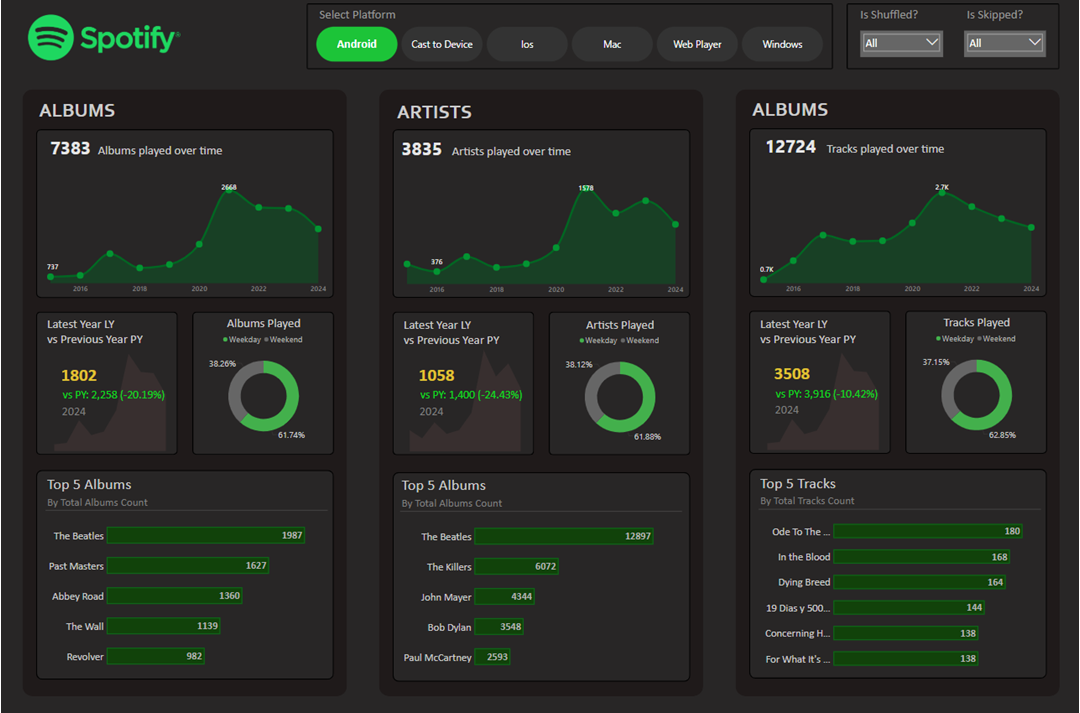
This dashboard visualizes Spotify listening activity over multiple years using data from streaming history. It tracks how albums, artists, and songs have evolved over time based on total plays.
Dashboard Screenshot
📊 Dashboard Features
- Time series charts showing albums, artists, and tracks played per year
- Top 5 artists, albums, and tracks by total play count
- Pie charts showing listening trends by weekday vs. weekend
- Platform filtering (Android, iOS, Web, etc.) and playback behavior (shuffle/skip)
⚙️ Tools & Technologies
- Power BI for dashboard creation
- Spotify Streaming History JSON data
- DAX for calculated KPIs and year-over-year comparisons